We are excited to announce “Reports” as a standalone feature and pillar in Rencore Governance alongside “Inventory”, “Checks”, “Automations” and “Dashboards”.
Reports have a similar architecture in comparison with Checks and Automations, which consists of prebuilt templates and libraries that create richer and more granular reports relating to specific use cases. Of course, you can always configure your own reports with the well-known flexible report builder using all objects and their relations from your inventory, much like with other areas of Rencore Governance.
Adding Reports as a standalone pillar to the Rencore Governance overview better aligns the user journey to discover, assess, act, and monitor continuously.
Breakdown of core pillars
Inventory
- At the core of your M365 governance journey, the Inventory provides you raw object data like Users, Teams, SharePoint Sites, and Power Apps, to name a few. With the Inventory, you can easily explore the data of all your connected services in a central place and track your KPIs over time.
Checks
- Checks are governance policies that allow you to monitor the compliance of your Microsoft 365 services according to your unique governance framework. You can choose from over 100 fully customizable policy templates or build your own and track their violations over time.
Automations
- Knowing your policy violations is a good start, but manually reviewing and resolving them does not scale with the ever-growing adoption and changing needs of Microsoft 365 services within your organization. With Automations, you can build multi-step resolutions of violations to perform direct actions in your tenant or alert end users to do those actions. The automations can be triggered manually or on schedule, depending on their purpose and frequency of use.
Reports
- The newly added reports help you to visualize your topics of concern at a point in time. This might be a specific report you need to provide regularly to a department in your organization, e.g., M365 licenses to procurement, or an overview of how your tenant is configured, for example, a breakdown of users by country.
Dashboards
- The rich and highly configurable Dashboards help you to bring all areas: Inventory KPIs, Compliance, Automations, and your Reports together in one place, for example, to monitor your security posture, service adoption, or platform costs.
Frequent reporting is crucial for communicating with stakeholders and sheds light on compliance, cost, and operational governance progress. Let’s build a report relevant for a specific use case and stakeholder.
Reports in action
Check out our feature highlight walk-through video here!
Use case: M365 cost-saving.
Report template: Inactive users.
Stakeholder: Procurement department.
Every department that has a stake in Rencore Governance will have a specific use case. In this example, the procurement department identifies with M365 cost-savings.
Once clicking on the Reports overview, you can instantly choose from a library of report templates.
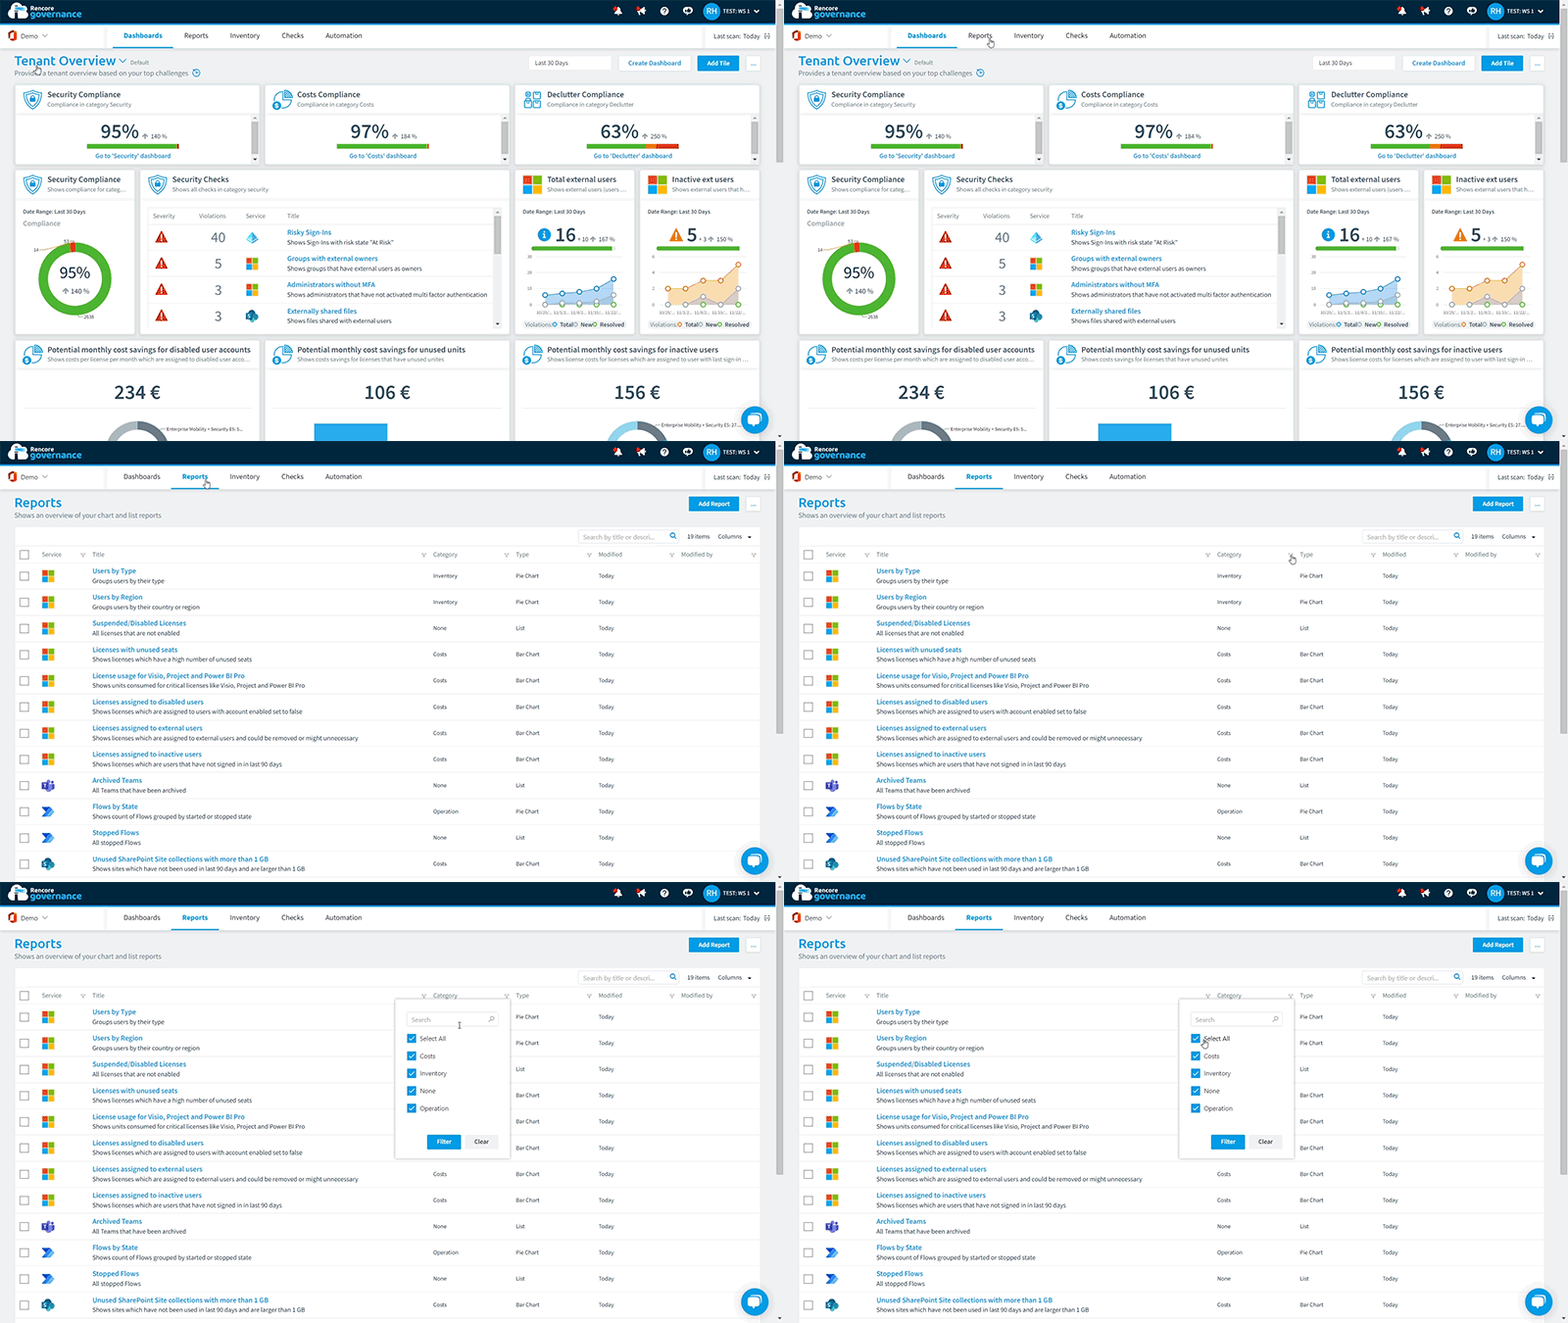
Each prebuilt report template often coincides with a related Check or Segment template, which are attributed to broader use cases.
In this case, we want to understand the cost-saving potential of optimizing user licenses. Identifying inactive users and redistributing their licenses will reduce M365 platform costs.
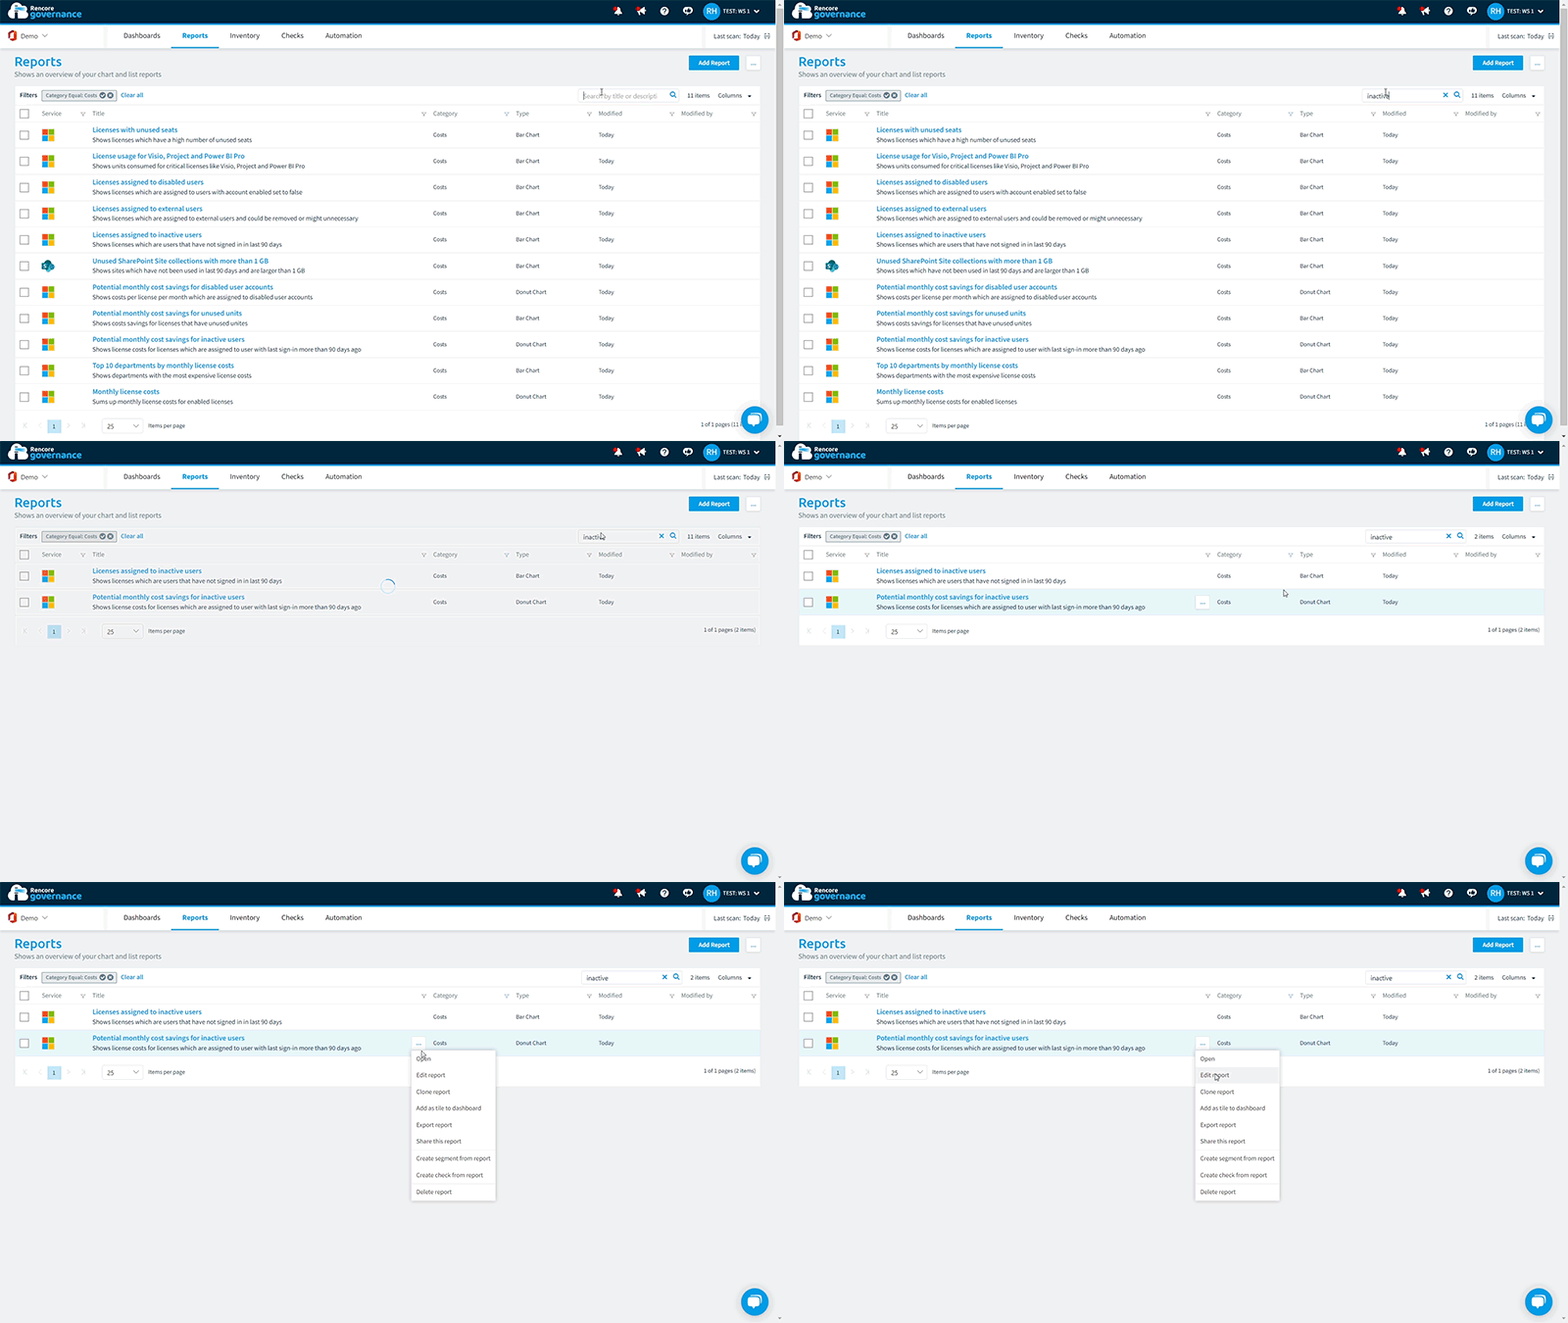
After clicking on the report, you see a visualization in the top left corner, an aggregation of the data to the right, and the Object details below, which offers a more granular look into the visualization.
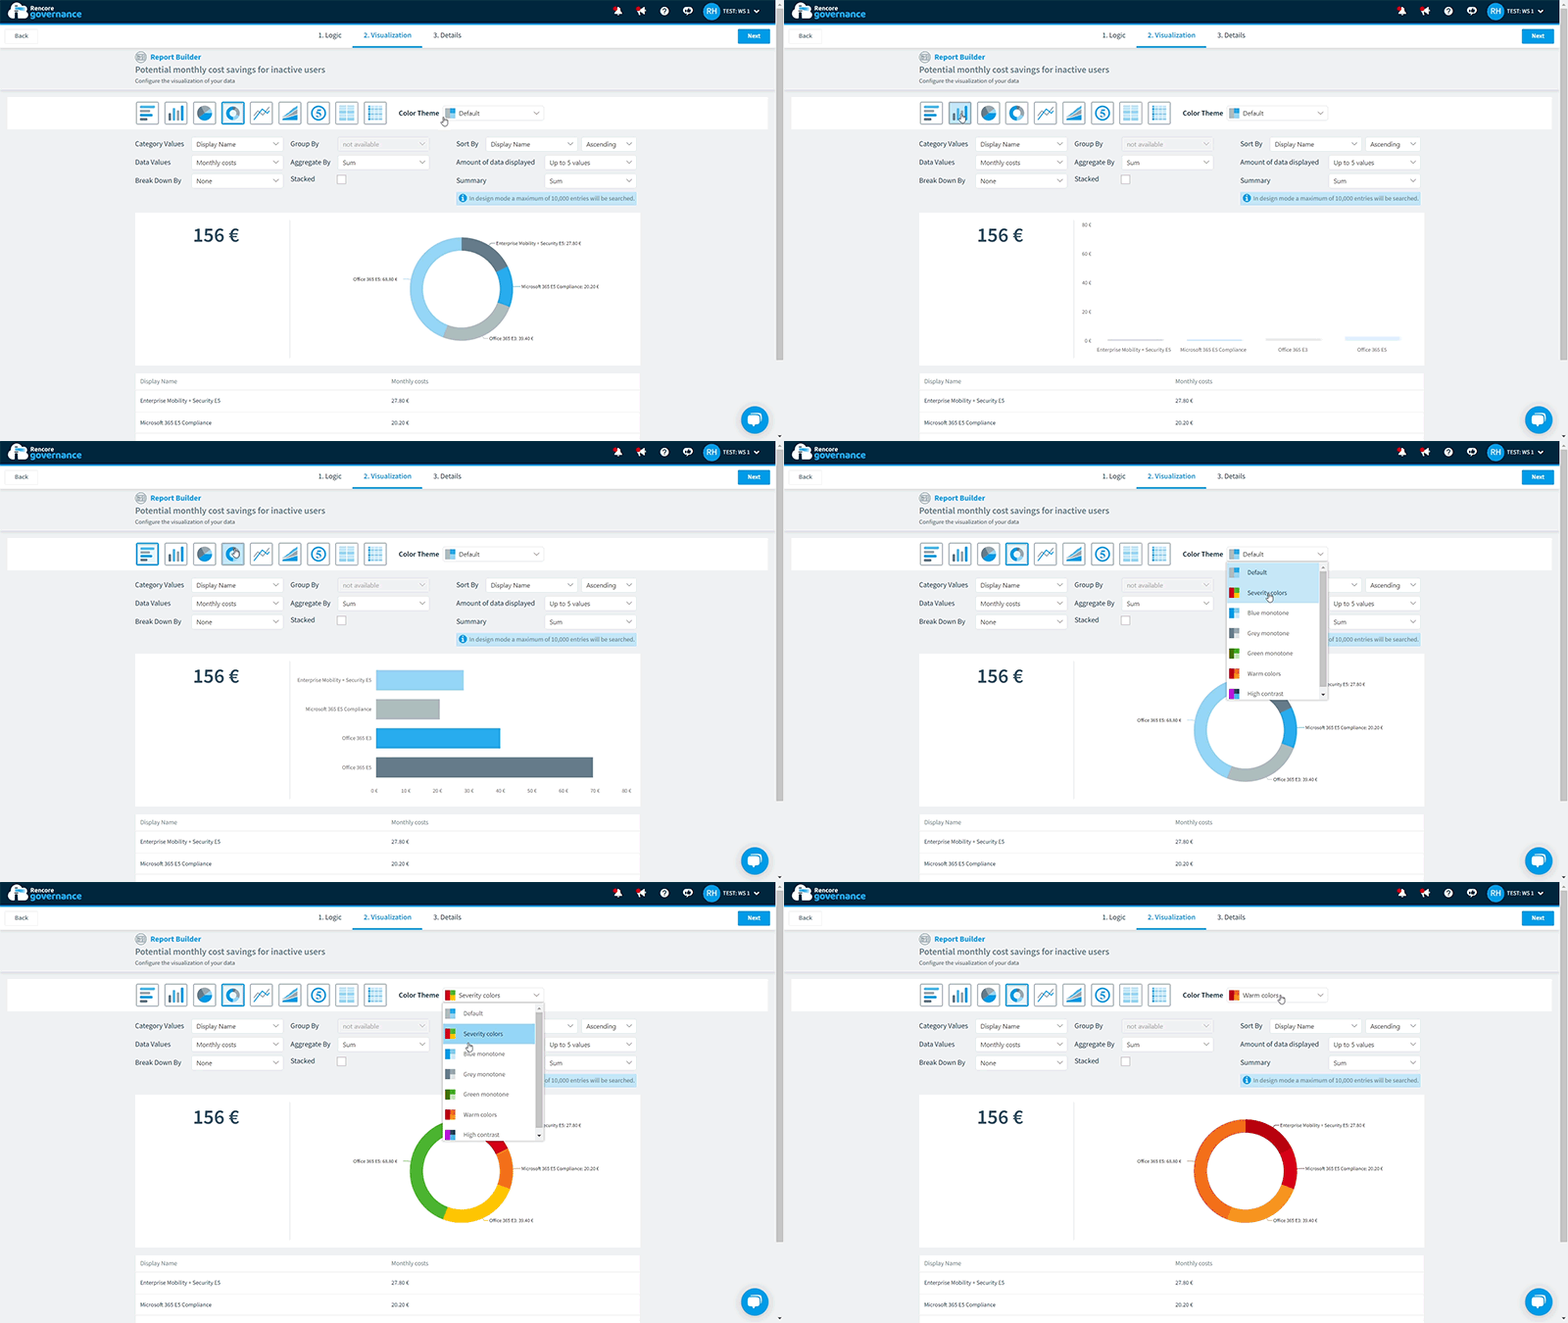
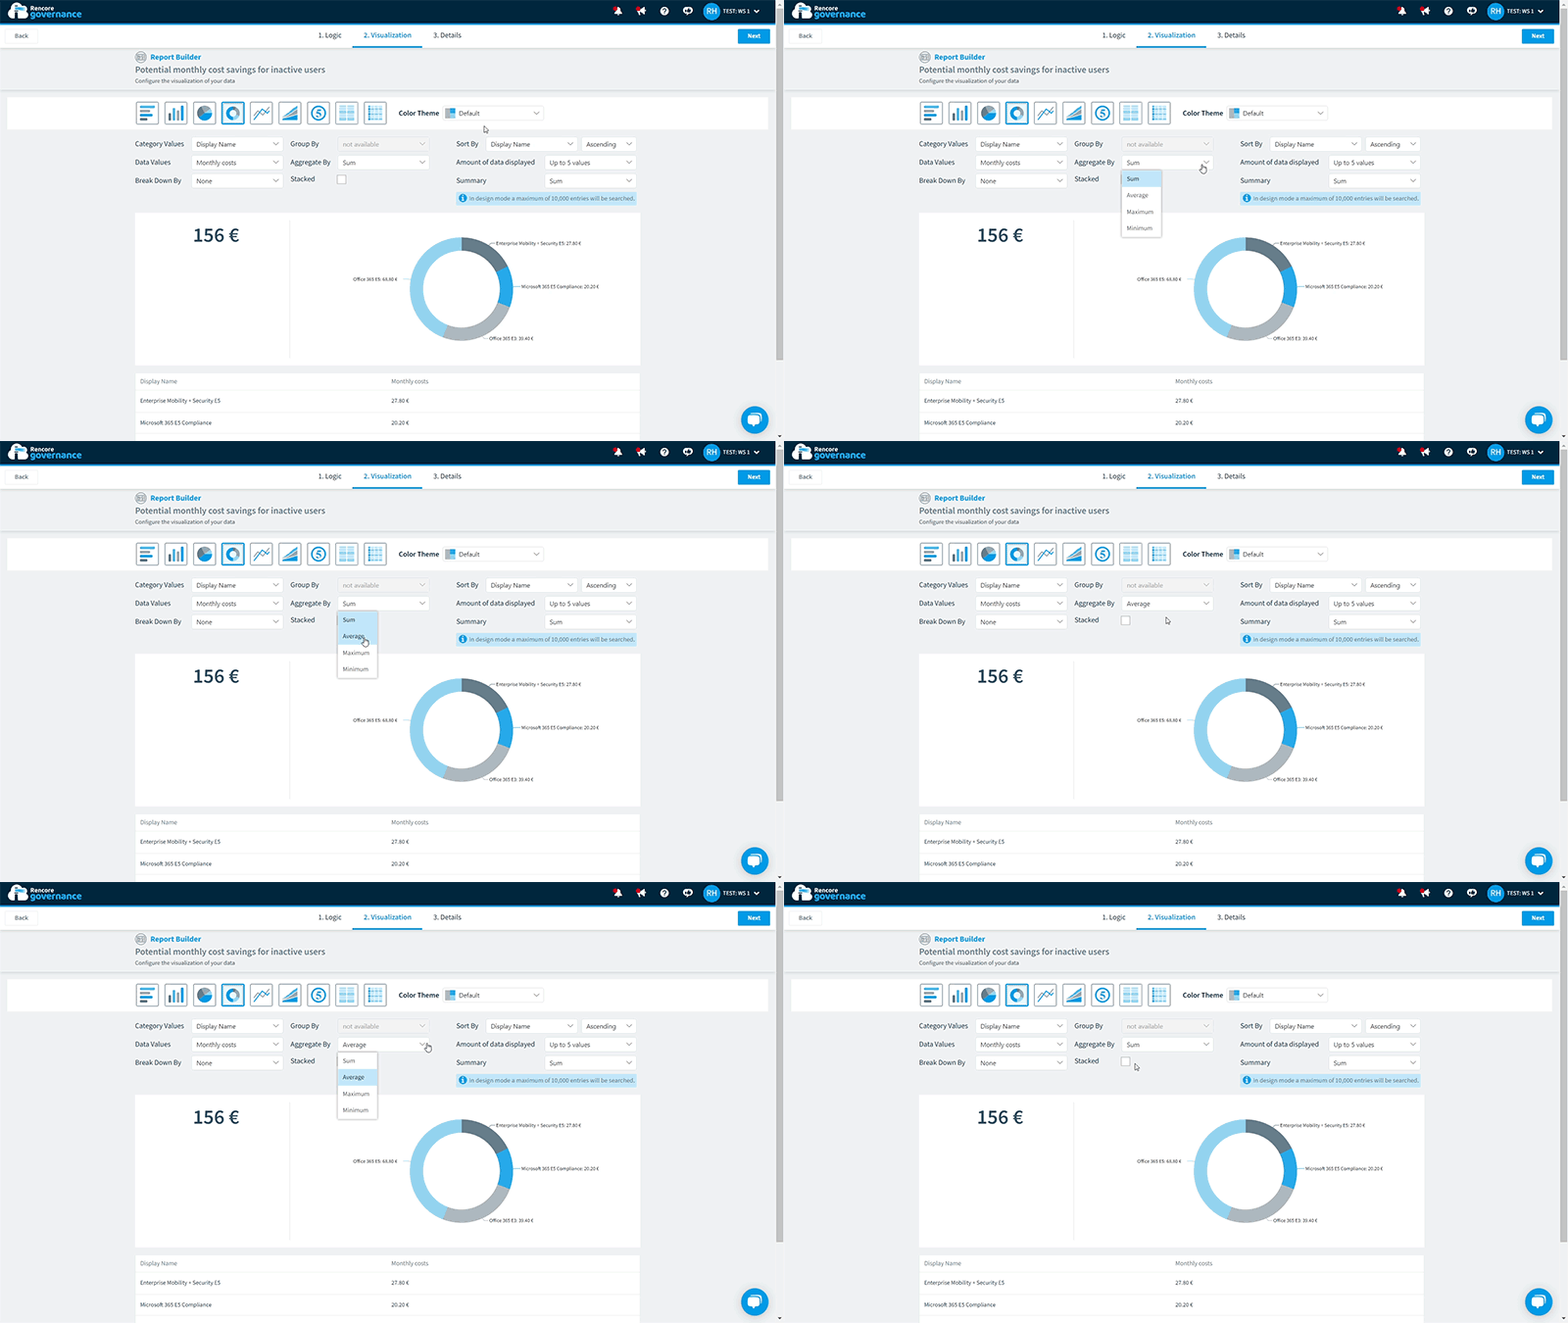
To customize the look and feel of the report, you have a three-step process: “Logic”, “Visualization”, and “Details”. You can choose between charts, graphs, matrices, KPIs, and simple lists.
Furthermore, you can add more valuable information by tweaking the “Data Values” and “Aggregate By” fields. In this instance, by attributing “Cost”, the Report becomes even more detailed, displaying a cost metric alongside your visual element, so procurement knows the exact potential savings.
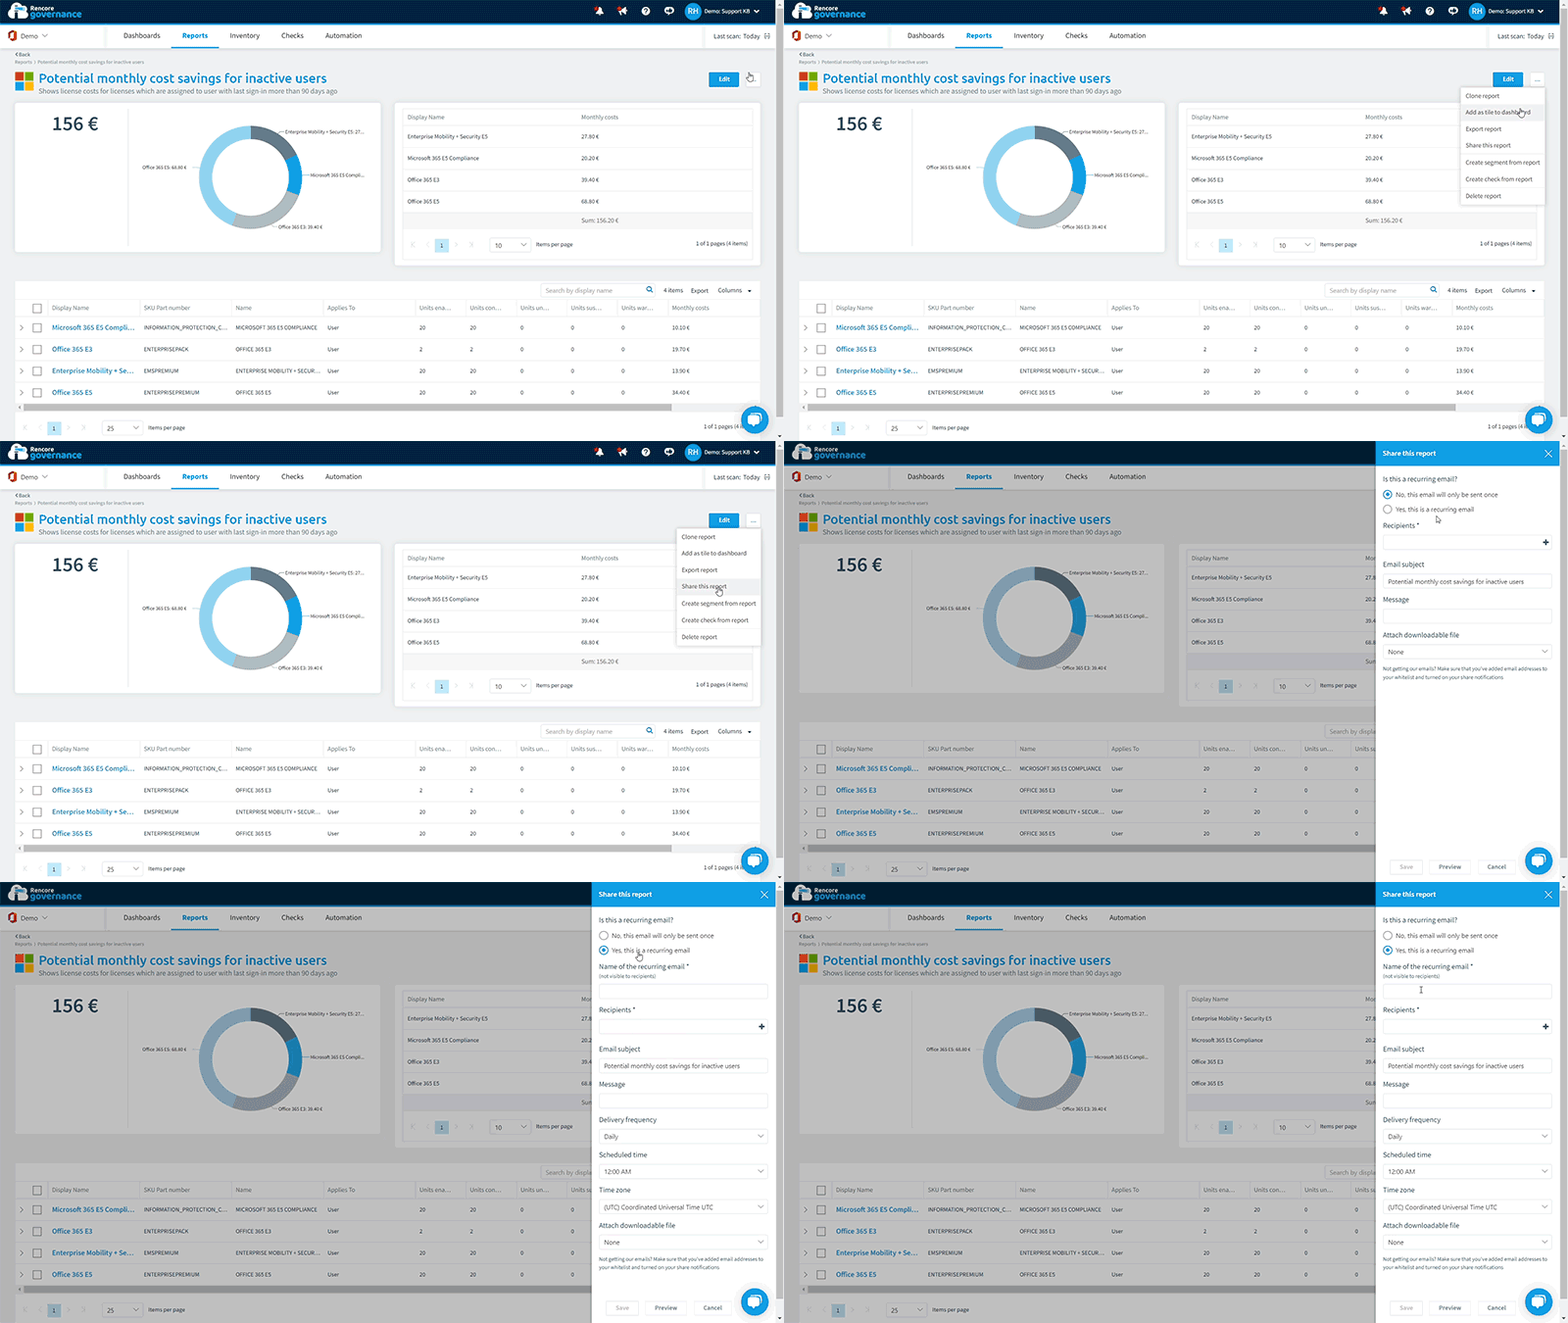
Lastly, the “Share Reports” function allows you to act. Your procurement team wants a detailed M365 cost-savings report addressing inactive users.
Schedule your reporting automation for the timeframe of choice, for example, weekly or bi-weekly, and add your chosen department. Procurement will receive their instant cost-saving potential and decide what action to take.
This is just one of many use cases. Discover the rest and try our new Reports today!
If you would like further information on how to build Reports in Rencore Governance, view our Reports documentation.
Happy governing!


